 خانه بیگ دیتا تحلیل شبکه های اجتماعی، متن کاوی، داده کاوی، اوسینت و داده های حجیم
مقایسه Neo4j با OrientDB با Titan
در رابطه با مقایسه سه پایگاه داده معروف مبنی بر گراف Neo4j و OrientDB و Titan خصیصه های زیر مورد بررسی قرار گرفته است. هدف کلی این مقایسه بررسی کارایی آن ها است. خصیصه های زیر برای مقایسه انتخاب شده و هر کدام از آنها بر روی هر سه بانک اطلاعاتی بررسی شده و زمان اجرای هر یک محاسبه شده است. هرچند موارد بیشتری برای بررسی وجود دارد. ضمن اینکه باید توجه داشت که با افزایش سایز گراف این اعداد تغییر خواهند کرد. چرا که گراف های انتخاب شده برای تست خیلی بزرگ نبوده اند. در مباحث قبل بانک های اطلاعاتی Neo4j و OrientDB مورد بررسی قرار گرفتند. اکنون مطالبی کوتاه در رابطه با Titan ارائه نموده و سپس به مقایسه پرداخته میشود.
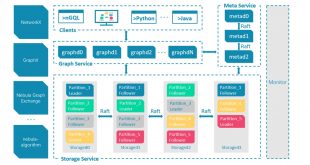
تایتان یک پایگاه داده توزیع شده و مقیاس پذیر مبتنی بر گراف است. تیتان بسیار برای مرتب کردن داده های گراف و انجام پرسوجو بر روی گراف بهینه عمل میکند. این بانک اطلاعاتی توان پردازش میلیارد ها راس و یال به صورت توزیع شده در میان خوشه های چند ماشینه را دراد. تایتان یک بانک اطلاعاتی transactional با توان پشتیبانی هزاران کاربر همزمان برای پرسوجوی های از نوع complex graph traversals به صورت real time است.
- Clustering Workload (CW): CW consists of a well-known community detection algorithm for modularity optimization, the Louvain Method. We adapt the algorithm on top of the benchmarked graph databases and employ cache techniques to take advantage of both graph database capabilities and in-memory execution speed. We measure the time the algorithm needs to converge.
- Massive Insertion Workload (MIW): we create the graph database and configure it for massive loading, then we populate it with a particular dataset. We measure the time for the creation of the whole graph.
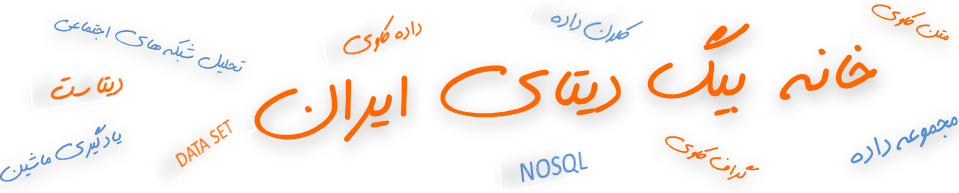
- Single Insertion Workload (SIW): we create the graph database and load it with a particular dataset. Every object insertion (node or edge) is committed directly and the graph is constructed incrementally. We measure the insertion time per block, which consists of one thousand edges and the nodes that appear during the insertion of these edges.
- Query Workload (QW): we execute three common queries:
- FindNeighbours (FN): finds the neighbours of all nodes.
- FindAdjacentNodes (FA): finds the adjacent nodes of all edges.
- FindShortestPath (FS): finds the shortest path between the first node and 100 randomly picked nodes.
مجموعه داده انتخاب شده برای آزمایش و مقایسه به شرح زیر است:
For our evaluation we use both synthetic and real data. More specifically, we execute MIW, SIW and QW with real data derived from the SNAP dataset collection (Enron Dataset, Amazon dataset, Youtube dataset and LiveJournal dataset). On the other hand, with the CW we use synthetic data generated with the LFR-Benchmark generator which produces networks with power-law degree distribution and implanted communities within the network. The synthetic data can be downloaded form here.
نتیجه مقایسه
This section contains the results of each benchmark. All the measurements are in seconds.
####CW results Below we list the results of the CW for graphs with 1,000, 5,000, 10,0000, 20,000, 30,000, 40,000, 50,000 nodes.
| Graph-Cache | Titan | OrientDB | Neo4j |
|---|---|---|---|
| Graph1k-5% | 2.39 | 0.92 | 2.46 |
| Graph1k-10% | 1.45 | 0.59 | 2.07 |
| Graph1k-15% | 1.30 | 0.58 | 1.88 |
| Graph1k-20% | 1.25 | 0.55 | 1.72 |
| Graph1k-25% | 1.19 | 0.49 | 1.67 |
| Graph1k-30% | 1.15 | 0.48 | 1.55 |
| Graph5k-5% | 16.01 | 5.88 | 12.80 |
| Graph5k-10% | 15.10 | 5.67 | 12.13 |
| Graph5k-15% | 14.63 | 4.81 | 11.91 |
| Graph5k-20% | 14.16 | 4.62 | 11.68 |
| Graph5k-25% | 13.76 | 4.51 | 11.31 |
| Graph5k-30% | 13.38 | 4.45 | 10.94 |
| Graph10k-5% | 46.06 | 18.20 | 34.05 |
| Graph10k-10% | 44.59 | 17.92 | 32.88 |
| Graph10k-15% | 43.68 | 17.31 | 31.91 |
| Graph10k-20% | 42.48 | 16.88 | 31.01 |
| Graph10k-25% | 41.32 | 16.58 | 30.74 |
| Graph10k-30% | 39.98 | 16.34 | 30.13 |
| Graph20k-5% | 140.46 | 54.01 | 87.04 |
| Graph20k-10% | 138.10 | 52.51 | 85.49 |
| Graph20k-15% | 137.25 | 52.12 | 82.88 |
| Graph20k-20% | 133.11 | 51.68 | 82.16 |
| Graph20k-25% | 122.48 | 50.79 | 79.87 |
| Graph20k-30% | 120.94 | 50.49 | 78.81 |
| Graph30k-5% | 310.25 | 96.38 | 154.60 |
| Graph30k-10% | 301.80 | 94.98 | 151.81 |
| Graph30k-15% | 299.27 | 94.85 | 151.12 |
| Graph30k-20% | 296.43 | 94.67 | 146.25 |
| Graph30k-25% | 294.33 | 92.62 | 144.08 |
| Graph30k-30% | 288.50 | 90.13 | 142.33 |
| Graph40k-5% | 533.29 | 201.19 | 250.79 |
| Graph40k-10% | 505.91 | 199.18 | 244.79 |
| Graph40k-15% | 490.39 | 194.34 | 242.55 |
| Graph40k-20% | 478.31 | 183.14 | 241.47 |
| Graph40k-25% | 467.18 | 177.55 | 237.29 |
| Graph40k-30% | 418.07 | 174.65 | 229.65 |
| Graph50k-5% | 642.42 | 240.58 | 348.33 |
| Graph50k-10% | 624.36 | 238.35 | 344.06 |
| Graph50k-15% | 611.70 | 237.65 | 340.20 |
| Graph50k-20% | 610.40 | 230.76 | 337.36 |
| Graph50k-25% | 596.29 | 230.03 | 332.01 |
| Graph50k-30% | 580.44 | 226.31 | 325.88 |
####MIW & QW results Below we list the results of MIW and QW for each dataset.
| Dataset | Workload | Titan | OrientDB | Neo4j |
|---|---|---|---|---|
| EN | MIW | 9.36 | 62.77 | 6.77 |
| AM | MIW | 34.00 | 97.00 | 10.61 |
| YT | MIW | 104.27 | 252.15 | 24.69 |
| LJ | MIW | 663.03 | 9416.74 | 349.55 |
| EN | QW-FN | 1.87 | 0.56 | 0.95 |
| AM | QW-FN | 6.47 | 3.50 | 1.85 |
| YT | QW-FN | 20.71 | 9.34 | 4.51 |
| LJ | QW-FN | 213.41 | 303.09 | 47.07 |
| EN | QW-FA | 3.78 | 0.71 | 0.16 |
| AM | QW-FA | 13.77 | 2.30 | 0.36 |
| YT | QW-FA | 42.82 | 6.15 | 1.46 |
| LJ | QW-FA | 460.25 | 518.12 | 16.53 |
| EN | QW-FS | 1.63 | 3.09 | 0.16 |
| AM | QW-FS | 0.12 | 83.29 | 0.302 |
| YT | QW-FS | 24.87 | 23.47 | 0.08 |
| LJ | QW-FS | 123.50 | 86.87 | 18.13 |
####SIW results Below we list the results of SIW for each dataset.
منبع:
https://github.com/socialsensor/graphdb-benchmarks
آدرس کانال تلگرام سایت بیگ دیتا:
آدرس کانال سروش ما:
https://sapp.ir/bigdata_channel
جهت دیدن سرفصل های دوره های آموزشی بر روی اینجا کلیک کنید.
Visits: 6796
برچسبBig Data neo4j Titan پردازش گراف تایتان تحلیل گراف توزیع شده گراف گراف های بزرگ مبتنی بر گراف مقایسه مقایسه Neo4j
نوشته های مرتبط

همچنین ببینید

تحلیل گراف های بزرگ با آپاچی فلینک (Apache Flink)
تعریف جریان داده: جریان داده ها، داده هایی هستندکه بطور مداوم توسط هزاران منبع داده …
آموزش کامل نت ماینر (NetMiner) همراه با مثال
فهرست مطالب آمورش NetMiner تهیه کننده: حمید غلامی 1-مقدمه NetMiner چیست سیستم مورد نیاز درباره …